1/6


Barograph
1K+ดาวน์โหลด
7.5MBขนาด
1.3.6(10-06-2024)เวอร์ชั่นล่าสุด
รายละเอียดรีวิวเวอร์ชั่นข้อมูล
1/6
คำอธิบายของBarograph
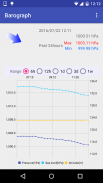
กราฟความดันบรรยากาศค่าเฉลี่ยของระดับน้ำทะเลความกดดันของบรรยากาศ, ระดับความสูง
คุณสามารถเห็นการเปลี่ยนแปลงในความดันบรรยากาศสายตา
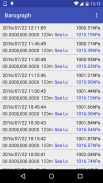
นอกจากนี้คุณสามารถเห็นค่ายังต่ำสุดและสูงสุดของความดันบรรยากาศที่ผ่านมา 24 ชั่วโมง
ค่าเหล่านี้ให้ดูค่าที่วัดได้จากมาร์ทโฟนของเซ็นเซอร์ คุณสามารถเข้าใจความดันบรรยากาศของพื้นที่ของคุณ
หน้าจอหลักโดยการวางวิดเจ็ตของ app นี้คุณสามารถเห็นความดันบรรยากาศซึ่งเป็นวัดในเวลาใดก็ได้
Barograph--เวอร์ชั่น1.3.6
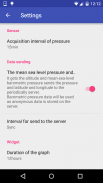
(10-06-2024)ข่าวใหม่Version 1.3.6-------------Added a mode to directly input values to calibration on the preferences screen.
Barograph - ข้อมูล APK
เวอร์ชั่น APK: 1.3.6แพ็คเกจ: jp.craftsoft.barographชื่อ: Barographขนาด: 7.5 MBดาวน์โหลด: 7เวอร์ชั่น : 1.3.6วันที่ปล่อย: 2024-06-10 05:15:29หน้าจอขั้นต่ำ: SMALLCPU ที่รองรับ:
ID ของแพคเกจ: jp.craftsoft.barographลายเซ็น SHA1: C1:22:7C:BE:9F:26:F2:3A:7E:96:41:14:04:9A:4C:A0:8D:C2:1E:D2นักพัฒนา (CN): Mikihiro Hayashiองค์กร (O): CraftSoftท้องถิ่น (L): Moriokaประเทศ (C): JPรัฐ/เมือง (ST): IwateID ของแพคเกจ: jp.craftsoft.barographลายเซ็น SHA1: C1:22:7C:BE:9F:26:F2:3A:7E:96:41:14:04:9A:4C:A0:8D:C2:1E:D2นักพัฒนา (CN): Mikihiro Hayashiองค์กร (O): CraftSoftท้องถิ่น (L): Moriokaประเทศ (C): JPรัฐ/เมือง (ST): Iwate
เวอร์ชั่นล่าสุดของBarograph
1.3.6
10/6/20247 ดาวน์โหลด7.5 MB ขนาด
เวอร์ชั่นอื่น
1.3.5
16/10/20237 ดาวน์โหลด4 MB ขนาด
1.3.4
7/9/20237 ดาวน์โหลด4 MB ขนาด
1.2.2
22/4/20197 ดาวน์โหลด9 MB ขนาด


แอปในประเภทเดียวกัน


English


